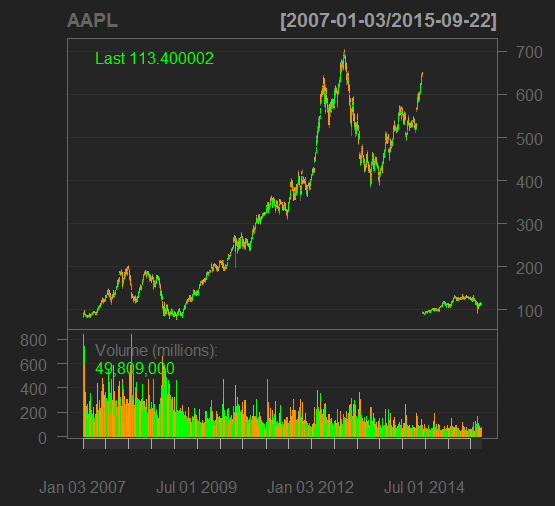
Analyze Stock Data using R and Quantmod Package

Coursera Review
Location
Online(Course Link)
Dates
On Demand
Course Categories
Business and Management
Certficate
No
Language
English
Course Fees
US Dollar 10 (Check Course Page for Last Price)No. of Attendant
Unlimited
Acquired Skills/Covered Subjects
- How to Pull down Stock Data using the R Quantmod Package,Ability to quickly calculate daily returns on stocks chosen,Ability to graph the stocks and calculate a Sharpe Ratio for risk evaluation
| Provider Name | Coursera |
|---|---|
| Training Areas |
|
| Website | https://coursera.org/ |
| About The Provider |
Coursera is
an American online learning platform founded by Stanford professors Andrew Ng and Daphne Koller that
offers massive open online courses (MOOC),
specializations, and degrees. Coursera works with universities and other organizations to offer online courses, specializations, and degrees in a variety of subjects, such as engineering, humanities, medicine, biology, social sciences, mathematics, business, computer science, digital marketing, data science, and others.
Coursera courses last
approximately four to ten weeks, with one to two hours of video lectures a
week. These courses provide quizzes, weekly exercises, peer-graded assignments,
and sometimes a final project or exam. Courses are also provided
on-demand, in which case users can take their time in completing the course
with all of the material available at once. |
In this 1-hour long project-based course, you will learn how to pull down Stock Data using the R quantmod package. You will also learn how to perform analytics and pass financial risk functions to the data.
Note: This course works best for learners who are based in the North America region. We’re currently working on providing the same experience in other regions
Learn step-by-step
In a video that plays in a split-screen with your work area, your instructor will walk you through these steps:
Task 1: In this task the Learner will be introduced to the Course Objectives, which is to how to pull Stock Data for analytics using the R quantmod Package. There will be a short discussion about the Interface and an Instructor Bio.
Task 2: The Learners will first download stock data using quantmod and the Yahoo Finance API. The Learner will then get practice with the syntax of quantmod by sub-setting the stock data.
Task 3: The Learner will get more experience manipulating the data using some R sub-setting functions.
Task 4: The Learner will be introduced to Data Frames and Time Series Objects and learn the difference between them. Moreover the learner will get practice converting between the two.
Task 5: The Learner will get practice pulling down adjusted daily return stock data using Microsoft's stock. The Instructor will teach you how to calculate the daily returns as well.
Task 6: The Learner will get practice combining data for comparison. FB and Microsoft will be the two companies used. Remember this is more difficult than it appears since Microsoft has been around longer than Facebook (unequal rows). The Instructor will show you how to merge the data as to not have errors.
Task 7: Learners will get practice calculating the Sharp Ratio on multiple stocks to see which stock is truly the riskier asset or the stock with the best risk return profile.